A reading method in six checks. The aim is not to go through every block, but to confirm that the solution answers the project before producing the report.
Recommended order of checks
1. Basis of the studyProject, TDH and sizing mode.
2. Selected solutionPump, solar array and stated production.
3. CoverageCritical month and typical day.
4. HydraulicsDiameter, velocity, losses and pressure.
5. ElectricalStrings, voltages and operating conditions.
6. ReportLast check before printing.
1
Confirming the basis of the study
The header must match the project that has just been entered.
Project
The daily need, the town and the TDH recalled in the introduction text are to be checked.
Sizing PRO
“Average month” targets an average production. “Worst month” uses the least favourable month of the period studied and restarts the calculation.
Action
In case of a discrepancy, the answers are the place to go back to, rather than correcting the result mentally.
A setting that changes the sizing must be chosen before comparing solutions or printing the report.
2
Identifying the selected solution
The active tab and the three summary tiles come first.
Pump
Model selected and catalogue limits. The maximum flow indicated is not the flow at the operating point of the project.
Solar array
Total power, number of panels and organisation of the strings.
Production
Stated average and seasonal range. These values are results of the study, not fixed characteristics of the pump.
Alternatives
The tabs make it possible to examine other compatible solutions. The “Compare” button PRO shows two solutions side by side.
The summary serves to identify the solution, not to validate the whole project on its own.
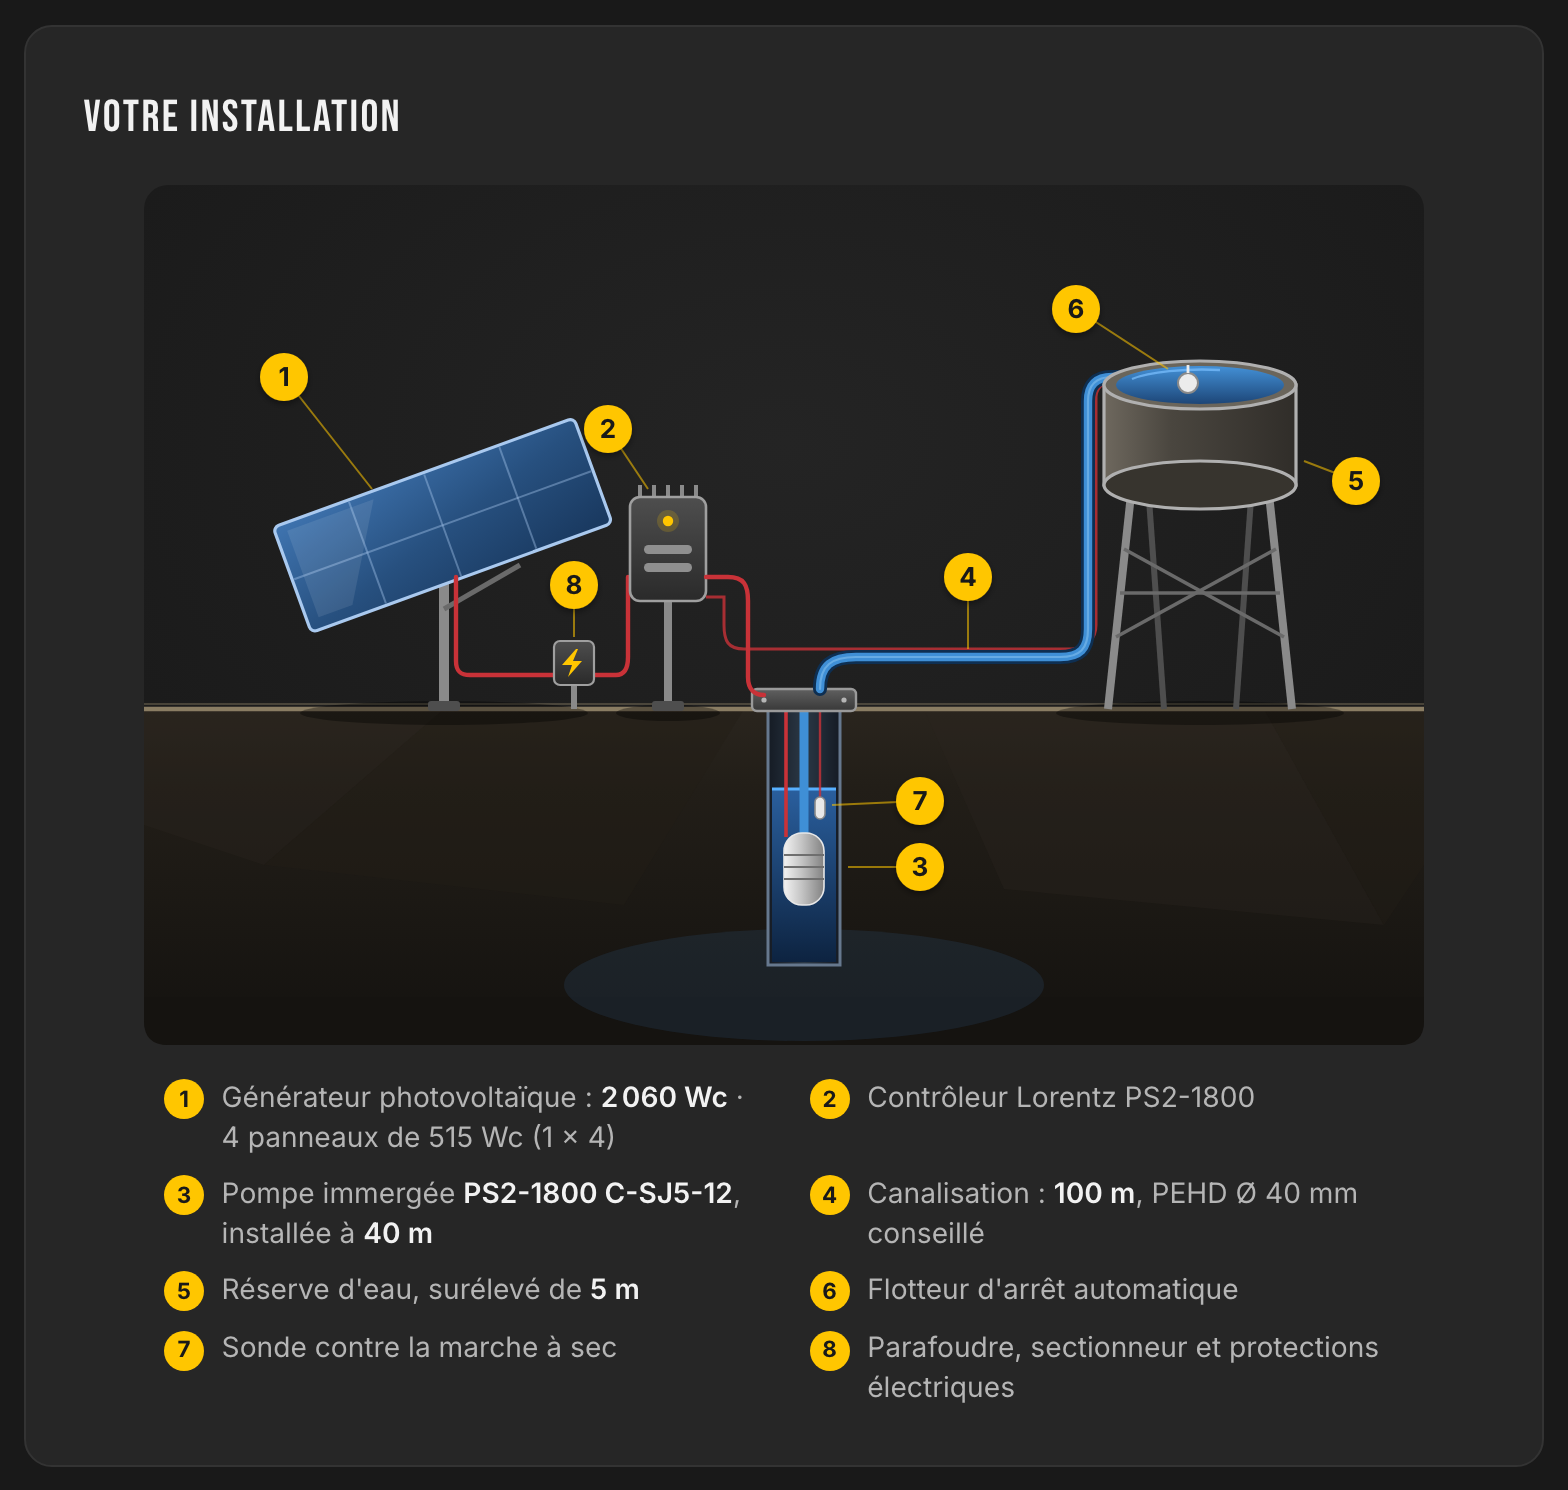
Checking the installation diagram
The diagram translates the options declared: reserve, float switch, backup source, protections and type of controller. The markers in the legend must match the equipment expected.
The diagram is a functional summary. The site sizing still has to be checked against the manufacturers' documents and the real conditions.3
Checking the coverage of the need
The monthly production answers the main question: is the need reached during the useful period?
Need line
The horizontal line represents the daily need declared.
Monthly bars
They show the production estimated for each month.
Critical month
It corresponds to the least favourable month within the period studied.
View the values
The table gives the monthly figures used to document the result.
The PRO settings for the number of panels and the angle recalculate the results displayed.
Checking a typical day
The block “Daily output” shows how the flow changes over one day of the month selected. The tiles sum up the peak flow, the volume produced and the need.
Changing the month updates the chart and its three indicators.
Constant pressure. When a sprinkler, an irrigation gun or a centre pivot is selected at step 3, these two blocks give way to “Solar and backup, month by month” and to “A typical day in {mois}”, and the autonomy block disappears. This reading is detailed on Constant-pressure watering.
4
Checking the hydraulics
This block checks the pipe at the real flow of the solution selected.
Pipeline
Diameter and pressure class proposed.
Velocity
The verdict displayed flags a velocity that is correct, slow, fast or too fast.
Head losses
Additional head due to friction in the pipe.
Neighbouring diameters
They show the effect of a smaller or larger diameter on the losses.
Basis of calculation
The material and the real condition of the pipe must be compared with the assumption displayed.
A hydraulic warning calls for a check of the project, not only a reading of the diameter proposed.5
Checking the solar array
The electrical configuration must stay within the limits of the pump or of the controller.
Configuration
Number of panels per string and number of strings in parallel.
Vmp
Voltage at the maximum power point, compared with the recommended minimum when it is displayed.
Voc when cold
Open-circuit voltage in the cold condition used, to be kept below the maximum of the controller.
Panel chosen
The model actually planned must match the model used in the study.
The detailed reading of the voltages and the cables continues in the technical appendix.
The button “Rapport d'étude (PDF)” opens the document in a new tab.
The button sits under the result blocks, once the solution has been selected.
The right solution tab is active.
The sizing mode is final.
The manual settings for the array and the angle are deliberate.
The hydraulic warnings have been examined.
The panel used matches the equipment planned.
The contact details of the PRO account are up to date.
In the print window, enabling “Graphiques d'arrière-plan”, the background graphics option, keeps the yellow and black solid areas.
Sections without data are not printed and the contents list recalculates itself.
The AI answers your questions PRO
The block answers questions about the study displayed and, when they are available, about the technical documents associated with the pump. It does not replace a technical check. An uncertain answer must be verified in the data of the study or with support.
The number of questions is counted at three levels: a cap per study, a cap per day and per pro account, and a monthly cap across the whole service. Under the answer, the note indicates the state of the first level: “You have {n} question(s) left for this study.”
The note under the answer recalls the origin of the answer and the number of questions left for this study.
A cap reached stops the module, not the study: the result blocks and the report remain available. The corresponding messages and what to do are set out on Solve a problem.