Help centreReport and appendix
Technical reference

Reading the report and
the technical appendix

The appendix gathers the cabling data and the operating conditions calculated for the solution. It helps prepare the site work, without replacing the pump data sheet, the manufacturer's manual or the checks on site.

One content, two places

On screen, the appendix appears in a fold-out panel after the system characteristics. In the PRO report, it forms the last section. Lines that are absent do not concern the solution selected or have no usable data.

Reading rule. A value in the study describes the configuration calculated. Any difference in length, panel, temperature or equipment calls for a new check.
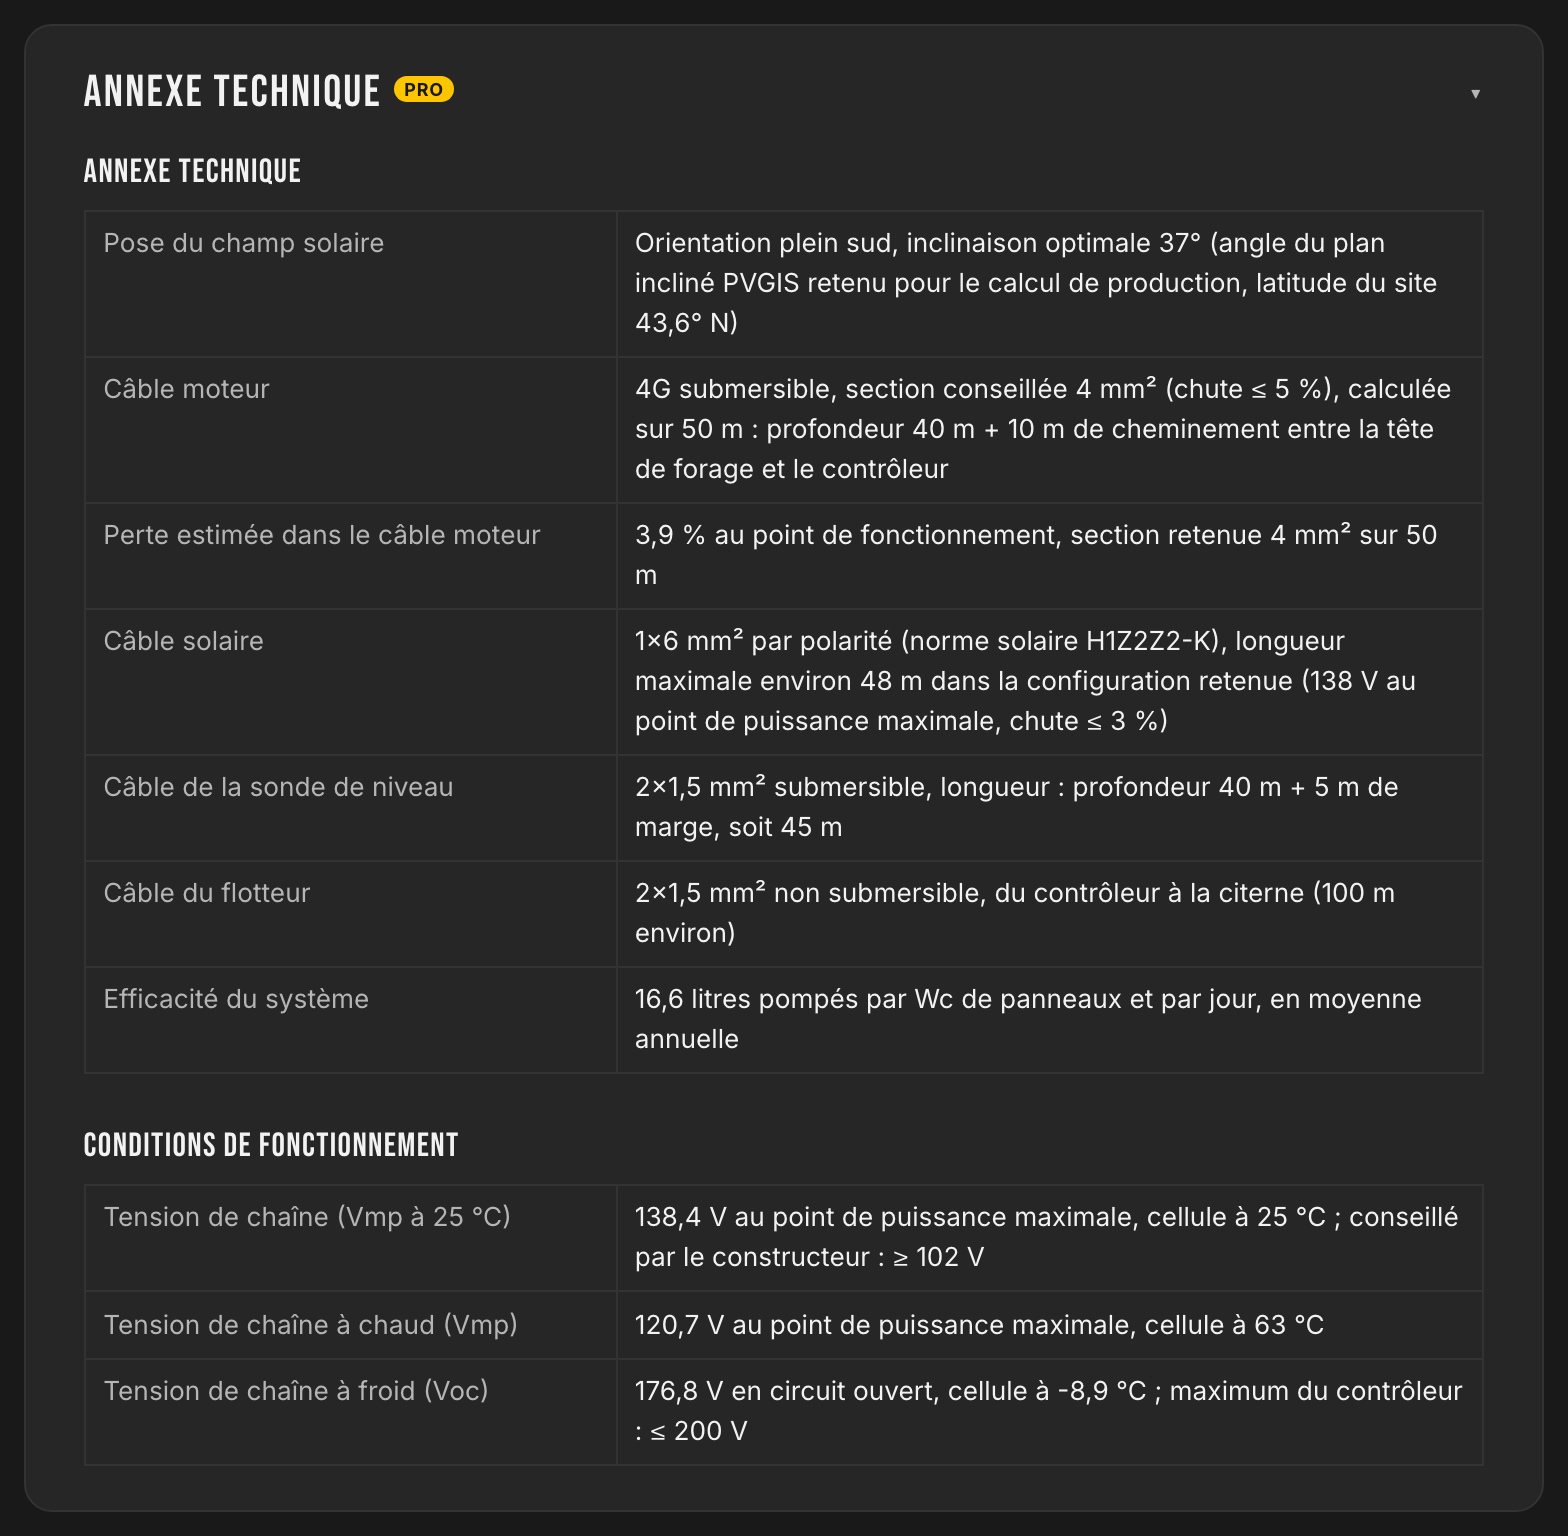
Technical appendix fold-out panel open, with the cabling table followed by the operating conditions.
1

Installation and cabling

Each line states what the study has selected and the check to make before execution.

Solar array installation

Displayed: orientation and tilt recommended for the site.

To check: absence of shading, real orientation of the structure and mounting constraints. An angle changed in the result must appear in the final report.

Motor cable

Displayed: type, recommended cross-section, calculated length and target voltage drop.

To check: real length between the controller and the pump, installation conditions, manufacturer's requirements and applicable electrical rules. A layout different from the one assumed in the study may change the cross-section.

Estimated loss in the motor cable

Displayed: loss at the operating point for the cross-section and the length selected.

To check: consistency with the cable actually planned. This value only remains valid for that configuration.

Solar cable

Displayed: type of cable, cross-section per polarity and indicative maximum length for the string selected.

To check: real route, grouping of the cables, temperature, protections and local requirements. The maximum length changes if the panel or the string configuration changes.

Level probe cable

Displayed: cross-section and length based on the depth entered, with a margin.

To check: planned position of the probe, real length and compatibility with the pump and its controller.

Float switch cable

Displayed: cross-section and approximate length between the controller and the reserve.

To check: real distance, routing, mechanical protection and type of float switch. The line only appears if the configuration uses this device.

System efficiency or solar share

Efficiency in litres per Wp serves to compare variants of the same project. It must not be used to compare two different sites directly.

In constant pressure, this line may be replaced by the annual share of the volume supplied by solar.

Pump temperature class

Displayed: the five classes of helical rotor pump ends, according to water temperature. Class 0: 0 to 10 °C · 1: 10 to 20 °C · 2: 20 to 30 °C · 3: 30 to 40 °C · 4: 40 to 50 °C, with a tolerance of ±2 °C on each range except the 0 °C floor. The line only appears when the pump selected has a helical rotor.

To check: the class appears in the designation of the pump unit and the system must only run within the range specified at order. The study calculates no class and asks for no water temperature: the line is for information.

Choice of the class

Displayed: the class is chosen at order, according to the borehole water temperature. SINES uses the next class up, sometimes two depending on water quality, never below.

To check: the real temperature of the borehole water, measured or confirmed, before placing the order.

PS2-200 HR

Line reserved for this range: on it the manufacturer always requires the next class up, to avoid starting problems under low irradiation. The rule is therefore shifted by one step compared with the other helical rotor pumps.

2

Solar array voltages

These lines frame the electrical configuration selected.

Operating conditions table with string voltages at twenty-five degrees, when hot and when cold.
The values depend on the panel, the number of modules in series and the temperatures used for the site.
String voltage (Vmp at 25 °C)

Voltage of the string at the maximum power point under standard conditions. When a recommended minimum is displayed, the calculated value must stay above it.

String voltage when hot (Vmp)

Operating voltage falls as the cells heat up. This line shows the value estimated in the hot condition of the study.

It serves to check the effect of temperature, without replacing the limits stated by the manufacturer.

String voltage when cold (Voc)

Open-circuit voltage rises in the cold. The calculated value must stay below the maximum input indicated for the controller.

Adding a panel in series or changing the panel model calls for this check to be done again.

Change to the array. The number of panels in series is not to be changed on site without a fresh check of the hot and cold voltages.
3

Special conditions

Some lines only appear for pumps with an external drive or for specific families.

Cut-in thresholdMinimum power needed at the drive before the pump starts delivering water.
Minimum continuous flowLimit stated to preserve motor cooling. The manufacturer's conditions prevail.
Flow sleeveNeed flagged when the installation geometry does not guarantee sufficient circulation along the motor.
Temperature sensorExternal sensor to be planned when the built-in protection cannot be used with the drive.
A line that is absent does not mean that no manufacturer's rule applies. It only means that this information is not published in this appendix.
4

Quick glossary

WpNominal peak power of a panel or of the array.
VmpVoltage at the maximum power point.
VocOpen-circuit voltage.
TDHTotal dynamic head required from the pump.
PNNominal pressure class of the pipe.
ControllerEquipment that adapts solar energy to the pump.
External driveSeparate drive used with certain pumps with an alternating-current motor.
5

Before sending the report

  • The cable lengths match the layout planned.
  • The panel and the string configuration have not changed.
  • The manufacturer's limits have been compared with the data sheet.
  • The options in the diagram match the real project.
  • Values that are not confirmed are flagged as such.